Measures and KPIs
Welcome everyone! This post is part of my wider series on how to implement low-code not just from a technology and process perspective, but also for a people enablement and adoption perspective to truly maximise value from the platform - This post gives an overview of the structured approach I’ve defined and how I’m breaking down my blog posts
Holistic Low-Code Enablement - Blog structure and navigation — EmPOWER Your World
Hey folks! Sorry it’s been a while since my last post! It has been a busy time with my trip to Poland to present at Baltic Summit, and to Farnborough, UK, to present at SouthCoastSummit! Back to it now so let’s get to it and talk about measures and KPIs!!
In business we have a love affair with measures and KPIs. We often measure a lot! Some might say we sometimes measure too much… and it’s not always clear WHY we are measuring those things? Who is actually looking at those measures and what do they do with them?
Let’s take a step back and think about what we’re trying to achieve with measures. We are trying to answer questions…
Are our experiments successful?
Are we growing?
Where do we need to intervene?
Are we delivering Value? As we’ve spoken about in my previous article this can mean different things for different people.
Solution value - Process improvement
People / Organisation - People transformation and changing our culture
IT - Improved insights into what’s important to the business
Essentially… Are we winning? And if not, what actions do we need to take?
Types of measure… Lead and Lag
When identifying our measures we need to think about the types of measures we need… There will be some that will track our outcomes, and some that will track, or drive, the actions we need to take to deliver those outcomes.
Lag measures are those longer term measures that track our outcomes and whether we’re winning or losing. They’re generally easy to understand, easy to identify, easy to measure…. And harder to change and they’re late stage in our process. Once set they’re usually fairly stable and don’t often change.
Lead measures are the ones which reflect the actions we believe we need to take to make us successful and can be tracked on an ongoing basis. They may be more experimental, or transient, and so may change as we test our hypotheses or exhaust that activity. Because it can be difficult to truly understand cause and effect in multidimensional systems these are often more difficult to identify and measure.
We need to identify both these types of measures to track our activities and our outcomes, and they’re evolve and grow as we understand our challenge more!
Our measurements
What do we want to measure? What’s the outcome we’re trying to drive?
We will need to align our lag measures to our vision and strategy. This can mean thinking at different levels. As we expand this section we’ll think more about measuring at an Organisation level, a platform level, our services, our solutions, and our people.
Initially we’re going to narrow our thinking to driving adoption. To do this we’re going to define a value hypothesis with Lag and Lead measures!
Our goal is to deliver as much value as possible - Remember that might be people, solution, or IT value!
To deliver that value we need to drive adoption… That adoption could be related to number of solutions created, or people adopting the platform and using the tools.
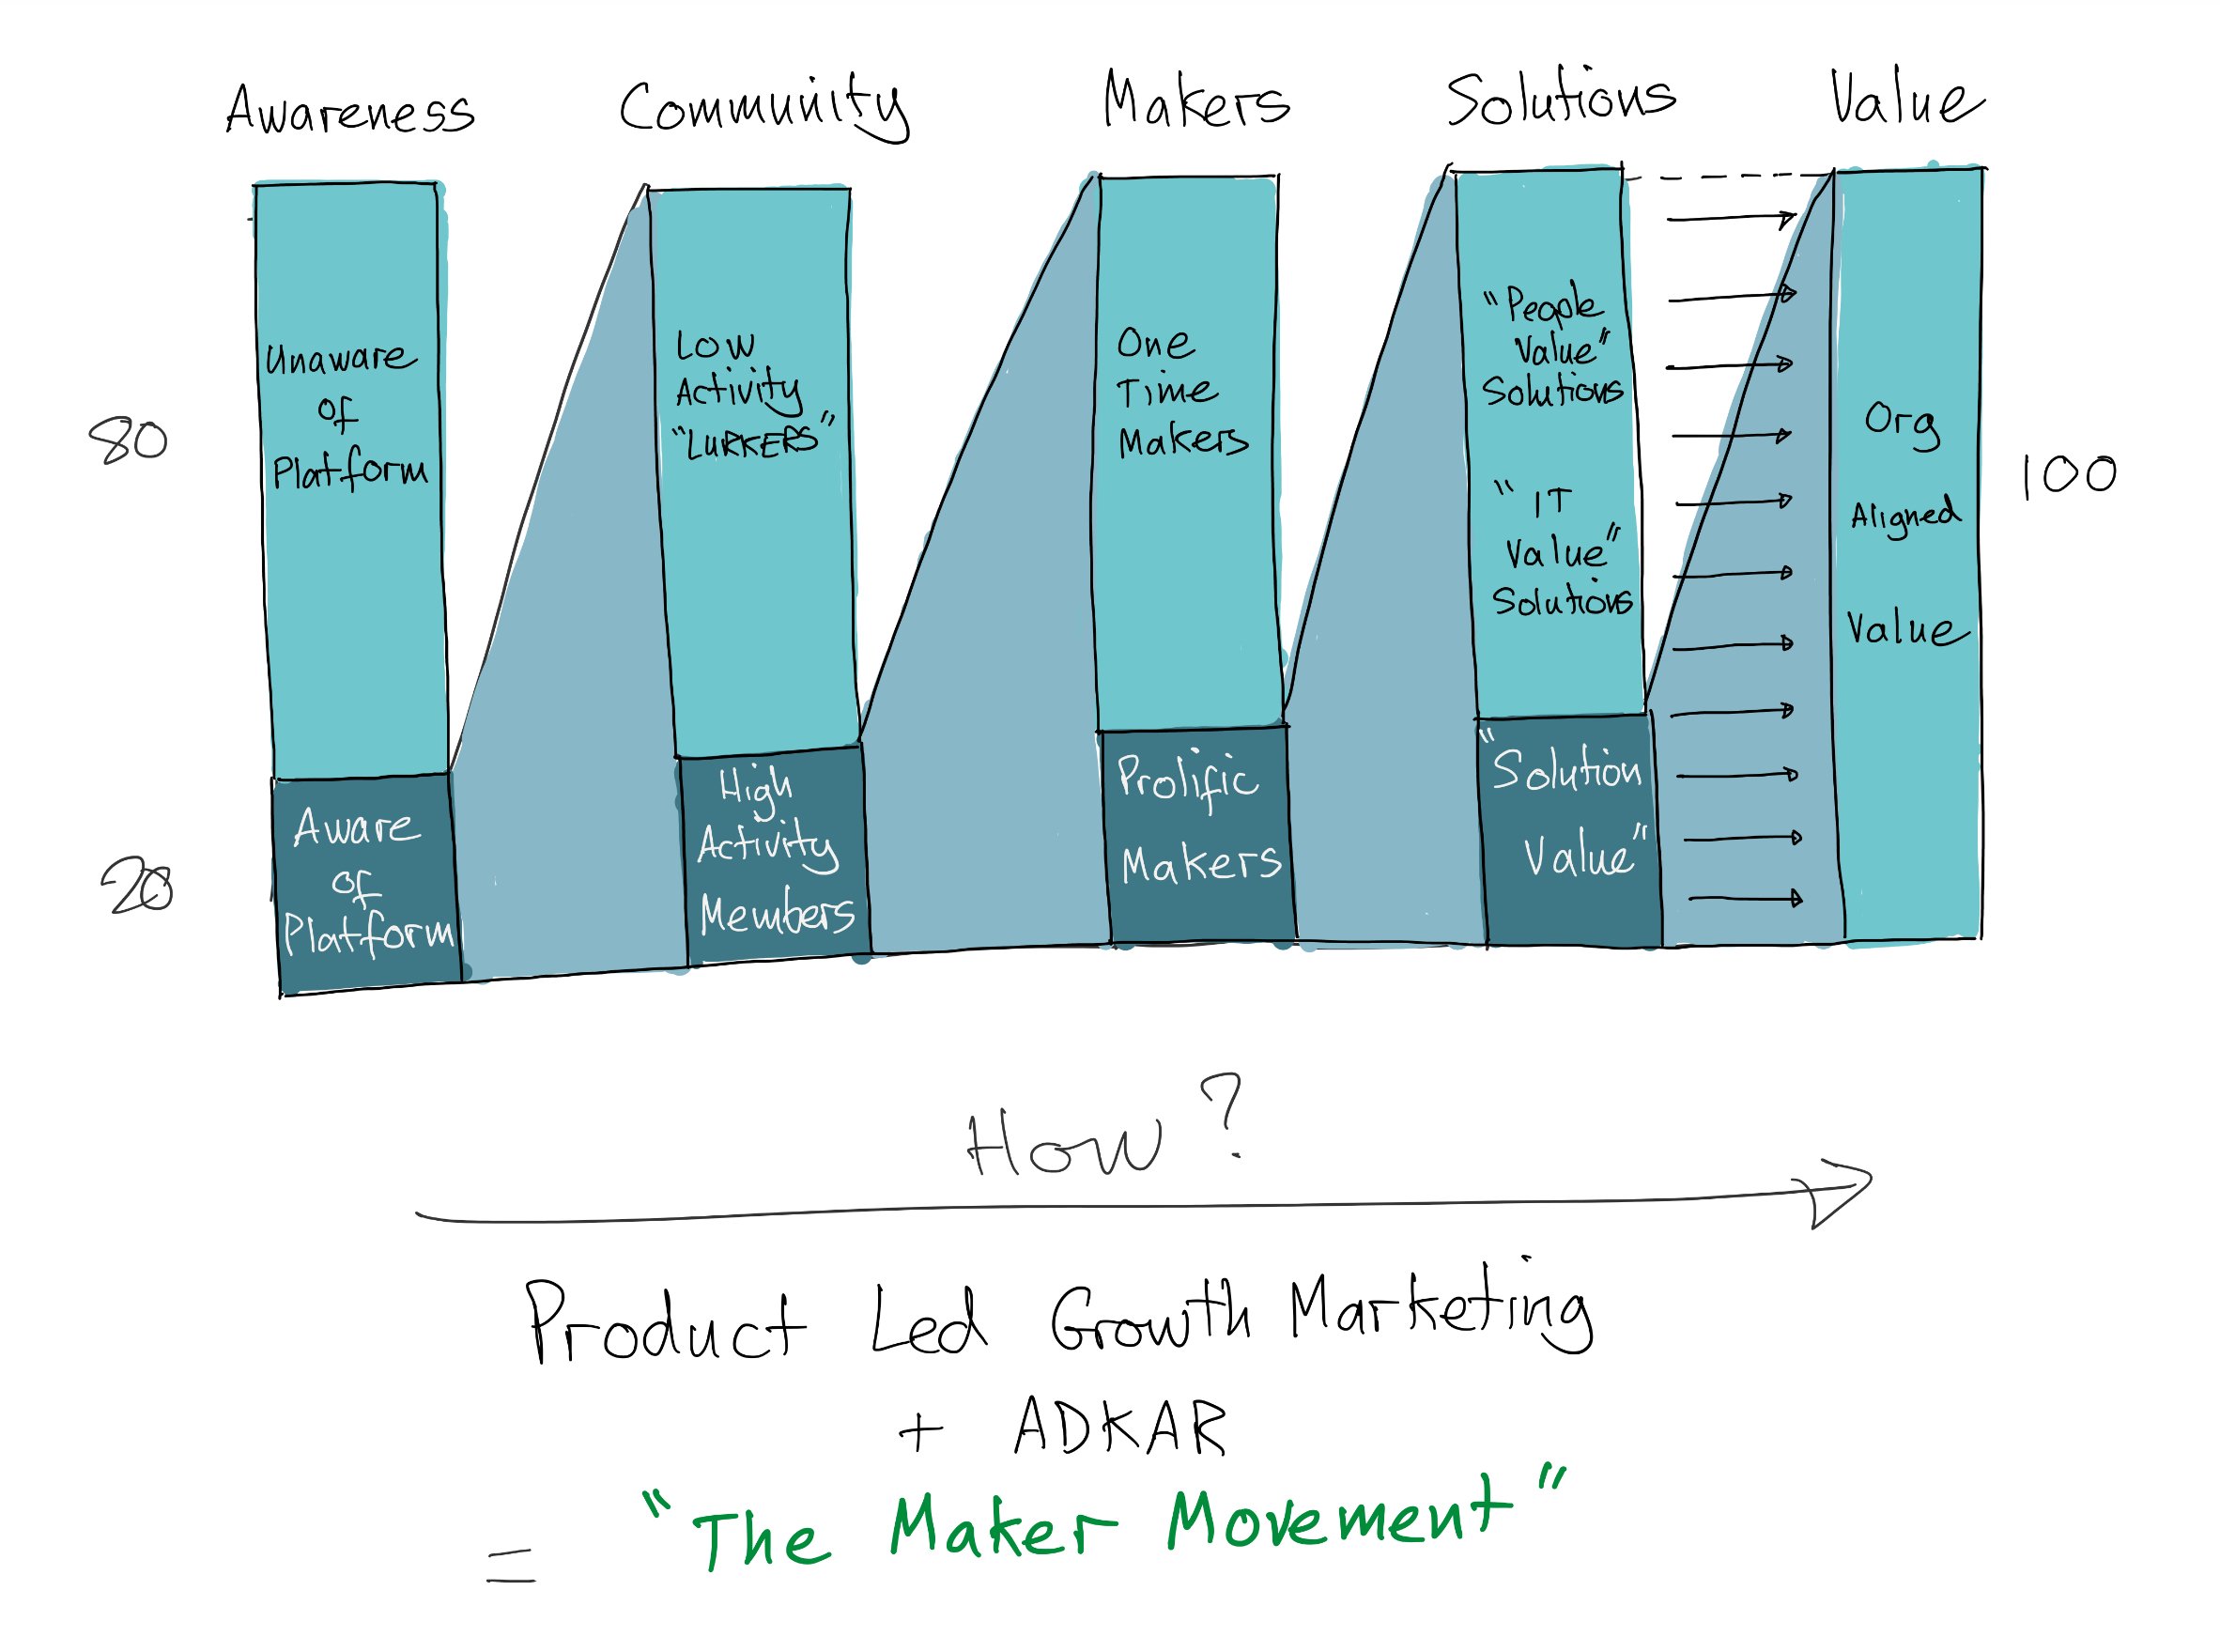
Our hypothesis is: To maximise value, we need to maximise the problems being solved. To do that we need people with the capability to build those solutions. To create the makers to build those solutions we need people who are aware of the platform, its capabilities, and be able to get help to use the platform - we need an active community!
At its highest level Value is our Lag measure and our other components are our Lead activities.
Our hypothesis is that by increasing our community and people aware of the platform, we’ll increase the number of makers. By increasing the number of makers we’ll increase the number of problems solved. By increasing the number of problems solved we’ll increase the amount of value.
If we think of these activities as being dependent on each other we have a chain of lead and lag measures
We can start simple with our measures to give us a way to track our activities and experiments, and whether they’re getting us closer to our target outcomes. It’s key to note that value isn’t just delivered at the last step. There’s value delivered throughout.
We think about how we maximise our value in our hypothesis… We can look at this as a sales funnel and a ‘numbers game’ where the more awareness we can generate through promoting the platform and through our story telling, the more value will be enabled.
This is awareness of what the platform is, what it can be used for, how to get started, where to find help materials, how to be part of the community, how to talk about value… All the stories that we tell.
We can visualise this using the 80:20 model to demonstrate the types of behaviours and engagement we need to target to push through the funnel.
This is a High Level view of measures and KPIs to drive adoption. This will be a topic that I’ll revisit. As mentioned earlier there are multiple levels that we will need to look at measures so we’ll get into those in a follow up post!
I’d love to hear your thoughts on measures and any questions or ideas you have that you’d like explored.


